
Changing Minds of Solo Commuters Through Strategic Communication
Professional Master's in Strategic Communication Program Capstone
Hubbard School of Journalism and Mass Communication, University of Minnesota
Executive Summary
The University of Minnesota Twin Cities faces a growing challenge in reducing its reliance on single–occupancy vehicles (SOVs). SOV use among students, staff, and faculty remains high, despite the presence of a strong transit system, bike infrastructure, and carpool programs. This reliance leads to traffic congestion, limited parking, and increased carbon emissions that undermine the University’s sustainability goals.
This capstone project examines how strategic communication can influence commuter behavior toward more sustainable alternatives, including public transportation, biking, and carpooling. Through a combination of secondary research, a 197–response primary survey, and audience analysis, the study identifies key barriers to change: perceived convenience, safety concerns, and lack of awareness. Note that these barriers do not include hostility toward alternatives. Two audience personas – ”Commuter Claire,” a Gen–Z student commuter, and “Reliable Roger,” a Gen–X staff member – illustrate how different segments require different messaging approaches.
Grounded in Uses and Gratifications, Nudge Theory, and the Theory of Planned Behavior, the proposed campaign focuses on peer–driven storytelling, practical tools, and light behavioral incentives. The campaign includes seven targeted tactics:
These tactics are designed to increase awareness of sustainable commute options by 15%, increase public transit use by 5%, and reduce parking contract sales for SOVs by 7% over the 2025–2026 academic year. The existing Parking and Transportation Services communications team can implement this campaign, supported by interns and cross–campus collaboration. The majority of the campaign’s $30,000 budget will be directed toward the Commute Calculator and transit incentives.
Evaluation will rely on a mixed–methods approach, including follow–up surveys, digital metrics, and usage data from transit programs. The campaign also includes built–in feedback loops to refine tactics over time.
Aligning the communication strategy with audience values, decision–making habits, and campus infrastructure will allow this campaign to position the University of Minnesota as a national leader in sustainable commuting.
Introduction
One does not have to spend long on the University of Minnesota Twin Cities campus to notice the traffic problem. Despite solid public transit options, students, faculty, and staff still rely heavily on single-occupancy vehicles (SOVs), and it is taking a toll. The result? Packed parking lots, longer commute times, and a carbon footprint that does not align with the U’s sustainability goals.
In response to these challenges, there is a growing need to promote alternative modes of transportation such as public transit, biking, and carpooling. These alternatives offer numerous benefits, including reduced traffic congestion, lower carbon emissions, and improved public health. However, despite these advantages, the adoption rate of these sustainable commuting options remains relatively low.
This capstone aims to explore strategic communication methods that influence commuters to adopt more sustainable transportation options. By understanding the perceived barriers and motivators, this study seeks to develop targeted communication strategies that can effectively encourage the University community to shift away from SOVs.
Organization Background and Problem Preview
The University of Minnesota Twin Cities, established in 1851, is one of the largest and most prestigious public research universities in the United States. With a diverse student body of over 50,000 students and a faculty and staff population exceeding 20,000 (University of Minnesota, n.d.), the University is a vibrant academic community. The campus spans across Minneapolis and St. Paul, integrating with the urban environment and contributing to the local economy and culture.
Over the years, the University has made substantial investments in infrastructure, research, and community engagement. It is renowned for its commitment to sustainability, evidenced by initiatives such as the “It All Adds Up” campaign and its Climate Action Plan (University of Minnesota, n.d.).
The Twin Cities campus is situated in a densely populated urban area, leading to significant commuter traffic. A large proportion of the University community relies on SOVs for their daily commute (University of Minnesota Parking and Transportation Services, 2022). This reliance on SOVs has resulted in several issues, including:
- Traffic congestion: The high volume of SOVs contributes to severe traffic congestion, particularly during peak hours, affecting not only the University community but also the broader metro area.
- Environmental impact: The extensive use of SOVs results in increased carbon emissions, which undermines the University’s sustainability goals and contributes to air pollution (Minnesota State Government, n.d.).
- Parking shortages: The demand for easily accessible parking spaces often exceeds the supply, leading to frustration among commuters.
Research
A secondary research review will look at existing case studies and data on commuter behavior and transportation strategies to provide a foundational understanding of the factors influencing transportation choices and the effectiveness of various communication strategies.
A primary research survey targeting the University community will provide insights into the specific attitudes, perceptions, and preferences of the community. The survey will help identify the unique challenges and opportunities within the University of Minnesota Twin Cities context.
Secondary Research
The Parking and Transportation Mode Share Study, last conducted in November 2022 (University of Minnesota Parking and Transportation Services, 2022), with 1,500 responses, found that University community members heavily rely on SOVs to commute to campus (Figure 1.0), with this trend increasing among staff and faculty (Figure 1.1).
Not all faculty and staff travel to campus daily. The survey broke down travel habits by day. When examining the “I don’t travel to campus on this day” response, it accounted for 41% of total weekly responses among staff and 36% among faculty, suggesting that hybrid schedules are influencing commuting behavior.Figure 1.0 – Commutes by Mode
Figure 1.2 – Modeshare by Status
Shifting the focus to more sustainable methods, biking is a leading sustainable mode, with 6.6% of faculty choosing it, making it the third most popular option, and 4.3% of staff. Transit has a slight but notable impact, remaining under 6% for both groups. Notably, the University introduced its Employee Transit Pass after the 2022 survey, offering free public transit benefits to staff working over 75% of the time and a marginal fee to staff working between 50–74% of the time (University of Minnesota, n.d.). After excluding “Campus bus,” which heavily skews towards student use, carpooling came in last for all categories, with only 1.4% of faculty and 1.5% of staff utilizing the method.
Reasons for faculty and staff to commute via SOV include a perceived lack of alternatives (20% of faculty report driving because they don’t see another viable option) and convenience. The cost and physical benefits of using a SOV were both rated extremely low (under 5%), indicating that there is room for improvement among faculty and staff by focusing on realistic, flexible, and affordable alternatives.
When measuring student behavior, the survey found that walking was the most common mode of transportation to campus, at 30%, which makes sense given the plethora of student housing available both on and near the Twin Cities campus. 24% of students indicated that they did not travel to campus on a given day, likely a reflection of the ongoing COVID-19 recovery era when the survey was conducted in 2022, and the continued availability of online classes. Driving remains a significant component of the puzzle, with 29% of students indicating the use of SOVs as their primary mode of transportation. Transit options, including public and campus transit, are used (a combined 31%), but still trail behind walking and driving.
These patterns at the University of Minnesota mirror national trends. According to a 2021 Harris Poll, 67% of U.S. adults use a car as their primary method of commuting, followed by having no commute at 28% and using public transit at 16% (Harris Poll & OAAA, 2021). Driving continues to dominate commuting habits due to a combination of time efficiency, personal control, and structural car dependency built into urban and suburban infrastructure. Most U.S. cities, including Minneapolis and St. Paul, are designed around vehicle use, making it difficult for non-drivers to navigate safely or efficiently (Milman, 2024).
Studies also show that predictability and convenience are key motivators behind choosing a car (Timmer et al., 2023, p. 6). Even if other options exist, many commuters opt to drive because they perceive it as more reliable and flexible, especially when juggling unpredictable schedules or poor weather, both of which are common in Minnesota. A 2024 Wall Street Journal analysis noted that the fastest car commutes were still twice as fast as their transit equivalents in many U.S. cities (Smith, 2024).
Motonormativity
Primary Research
To better understand the commuting behaviors and perceptions of the University of Minnesota community, an 18-question survey was distributed in late spring 2025. Promotion occurred through student parking contract sign-ups and the University’s annual transportation survey. In total, the survey received 197 valid responses, focusing on perceived barriers to sustainable commuting, satisfaction with current infrastructure, personal experiences with transit, and preferred messaging strategies (see Appendix A). As an incentive, respondents were given the opportunity to win one of two $25 Amazon gift cards.
Quantitative findings confirmed what national trends suggest: people are open to change, but they are not yet convinced. While 61% of respondents reported being either satisfied or very satisfied with biking and transit infrastructure, genuine enthusiasm was rare. Just 11% rated themselves very satisfied, and 37% selected neutral, indicating a large persuadable middle. Commute times were largely manageable: 65% of respondents commute between 10 and 30 minutes, with 17% traveling 30 to 60 minutes, and only six respondents reporting a commute over an hour.
Responses were split when asked how likely they would be to recommend public transit to others (Figure 1.2). Of those who answered, 32 were Promoters, 22 were Detractors, and 21 were Passives, resulting in an average score of 7.5 out of 10. This suggests that public transit is viable for some, but it still faces credibility challenges, especially regarding reliability and user experience.
Promoter (43%)
Neutral (28%)
Detractor (29%)
Figure 1.2 – Net Promoter Score
Open-ended responses echoed this tension. Many respondents cited location and convenience as the primary reasons for continuing to use single-occupancy vehicles. As one put it:
“If I lived closer to campus or in the city! I live in the suburbs and it’s honestly not worth the trouble vs paying 4 dollars for parking.”
Others noted a lack of viable connections:
“If there was a direct route to campus from where I live, I would be far more likely to use public transit.”
Positive stories were grounded in cost savings, efficiency, and a sense of ease, especially from bikers and seasoned transit users. For example:
“I have so many positive experiences on my bike commutes… I save money, and I get to zip past cars stuck in traffic!”
“I always enjoyed the communal aspect of riding the bus.”
However, negative experiences were raw and pointed. This highlighted safety issues, unpredictability, and discomfort. These may help explain why nearly 3 in 10 respondents fell into the “Detractor” category:
“If the open drug use was stopped, then I would like to take the light rail to and from work.”
“The crowding on public transit is concerning and frustrating for those of us at high risk for infectious diseases like COVID-19.”
When asked what kind of messages would make them reconsider their commuting habits, respondents leaned toward peer stories, environmental impact, and health benefits, not institutional facts or policy summaries. This suggests that communications should focus less on statistics and more on real-life success stories, user-centric benefits, and tangible improvements.
SWOT Analysis
Figure 1.3 – SWOT Analysis ChartStrengths
- A comprehensive transit system, including bus and rail
- Active mobility infrastructure like bike lanes, bridges, and tunnels
- Sustainability focus, including a strategic plan
- Community engagement and the ability to reach a large audience
- Partnerships with local transit authorities like Metro Transit
- Incentive programs like ZAP!
The University of Minnesota Twin Cities campus features a robust transit system, including free campus buses and a Universal/Employee Transit Pass that provides access to regional transit. The campus is also well-equipped for active mobility, featuring numerous bike racks, bike lanes, and the Gopher Bikes program. The University's commitment to sustainability is evident through its various initiatives aimed at reducing carbon footprints. Additionally, there is a high level of engagement from students and staff in sustainability practices, which supports these efforts. Partnerships with local transit authorities, such as Metro Transit, with the Universal and Employee Transit Pass programs further strengthen the university's transit options.
Weaknesses
- Parking infrastructure
- Transit convenience
- Awareness and usage
Despite the strengths, there are some internal challenges. The existing parking facilities may encourage people to continue using single-occupancy vehicles. Some students and staff find the waiting times and crowded buses to be a hassle, which can deter them from using transit. Moreover, not everyone on campus is fully aware of or takes advantage of the available transit and active mobility options.
Opportunities
- Technological advancements, transit passes on phones
- Urban development
- Increase incentives
Externally, there are several opportunities to enhance transit and active mobility. Technological advancements, such as better transit apps and real-time tracking, can make these options more appealing. Urban development projects are also creating better infrastructure for biking and walking, both on campus and in surrounding cities. Additionally, external funding and grants are available for sustainable transportation initiatives, providing extra resources. The University could also expand its incentive programs, like the ZAP! Biking Program, to include carpooling and transit usage, encourages more people to shift away from single-occupancy vehicles.
Threats
- Weather conditions
- Safety concerns
- Competing options, other choices seen as “easier”
There are also external threats to consider. Harsh winter weather can make it difficult for people to rely on active mobility and transit. Safety concerns, including crime and traffic accidents, can affect people's willingness to use these options. Economic factors, such as fluctuations in funding, can impact the quality and availability of transit services. Lastly, the convenience of ride-sharing services and personal vehicles can compete with transit and active mobility options.
Problem Statement
Despite having access to public transit, bike infrastructure, and carpool programs, a significant portion of students, faculty, and staff at the University of Minnesota Twin Cities campus continue to rely on single-occupancy vehicles (SOVs) for commuting. The heavy use of SOVs contributes to traffic congestion, high parking demand, and increased carbon emissions, which undermines the University's sustainability goals.
This problem is particularly severe during the academic year, when the campus population reaches its peak. To support the University’s commitment to environmental leadership among R1 institutions, there is a need to shift commuting behavior by increasing awareness, improving perceived accessibility, and promoting the benefits of alternative transportation.
A targeted communication effort should engage the University community during the 2025–26 school year to reduce the dependency on SOVs and position the University of Minnesota Twin Cities as a model for sustainable transportation.
Communication Goal
To establish the University of Minnesota Twin Cities as a leading campus for alternative transportation methods amongst R1 universities by promoting the benefits and accessibility of alternative transportation methods such as public transit, biking, and carpooling.
The chosen communication goal is a behavioral change goal. The rationale behind this goal is based on the need to address the environmental and logistical challenges posed by the high usage of SOVs on campus. By encouraging the university community to adopt alternative transportation methods, the project aims to reduce traffic congestion, lower carbon emissions, and alleviate parking issues. This goal aligns with the University's broader sustainability objectives and contributes to creating a healthier, more sustainable campus environment.
Objectives
Increase Awareness of Alternative Transportation Options: Develop and implement an awareness campaign to achieve a 15% increase in awareness of public transit, biking, and carpooling by the end of the 2025-26 academic year.
Increase Public Transit Usage: Achieve a 5% increase in public transit usage by the end of the academic year, leveraging the Universal and Employee Transit Passes.
Reduce SOV Parking Permit Sales: Achieve a 7% reduction in SOV parking permit sales by the following academic year.
Audience Analysis
Our campaign targets members of the University of Minnesota community who currently drive to campus alone, including students, staff, and faculty. These individuals have access to, but do not regularly use, alternative commuting options. While stakeholders like Parking and Transportation Services, Metro Transit, and University Leadership influence the infrastructure and policy landscape, the fundamental shift will come from changing the behaviors of everyday commuters.
Figure 1.4 (below) - Commuter Claire persona sample
Commuter Clair
That is about cost, not conscience. Research indicates that instrumental motives — cost, convenience, and safety — are the strongest predictors of mode choice among Gen–Z commuters (Borghini et al., 2025).
This reflects broader trends within our secondary research: journey time concerns, control, and cost are primary drivers of care use, and these are often more influential than environmental attitudes (Soza–Parra & Cats, 2023, 600). A migration between driving and alternative modes depends on Claire perceiving transit or biking as equally convenient and controllable.
Regarding media habits, Pew Research shows that Gen Z overwhelmingly uses:
with significant daily and near–constant engagement (Anderson et al., 2023). Gen Z also finds itself skeptical of institutions, instead favoring peer voices and relatable creators (Laughlin, 2024).
What does this mean for Claire? She is most likely to convert if she sees short, peer–driven content on the platforms she lives on.
TikTok “day–in–the–life” commute routines or Instagram Reels showcasing students saving time and money would be especially effective. Influencers she can relate to, such as fellow students who have replaced solo driving with biking or transit, will be far more persuasive than sustainability campaigns. Crafting messages around saved parking money, less stressful mornings, and commuter wins being delivered by people who look and sound like Claire will hit harder and perform better. That being said, students are not the only ones we are looking for a behavior change from.
Figure 1.5 (below) - Reliable Roger persona sample
Reliable Roger
His comment aligns with findings from a 2021 German multimodal commuting study. Through a crosstab analysis, autonomy, health, and quality of life emerged as top motivators, with crowding and safety concerns posing a significant deterrent to mode change (Timmer et al., 2023).
Reliable Roger’s profile of a suburban commuting University staff member reflects a Generation X commuter who values dependability, safety, and work–life balance. Gen X is often skeptical of flashy trends and tends to lean more towards a pragmatic decision–making style when commuting (Generational Messaging Playbook, n.d.). In transportation-related studies, this generation repeatedly prioritizes reliability and reduced wait times over environmental or social messaging (VISA et al., 2019). Furthermore, the concern about COVID–19 is supported by the same VISA study, which also showed that autonomy and safety concerns are influential factors for Gen–X.
Regarding media habits, Gen X engages daily on Facebook and YouTube (above 70% each), often in passive but information–rich modes (preferring to read others’ posts versus making their own) (Hedley, 2025). They are less influenced by influencers and more responsive to utility-focused content, such as DIY guides and testimonials (Hedley, 2025).
Roger needs clear, trustworthy messaging that addresses his concerns. Content like peer stories on reducing commuting stress due to crowds and guesswork, shared through email blasts, departmental newsletters, LinkedIn posts, and Facebook ads, could be especially helpful. This content should show off-peak transit routes and safety protocols, along with available apps that offer real-time data. This information, combined with data on how the Employee Transit Pass can add predictability and reduce cost, will be more convincing to Roger than environmental or viral challenges.
Brand Positioning
The University of Minnesota Twin Cities is not just a place to learn – it is a community committed to shaping the future of sustainable living. By transforming everyday commuting habits, the University positions itself as a model for accessible, modern, and climate–forward transportation among R1 institutions. This campaign reframes the University not only as a provider of transit infrastructure but as a partner in each community member’s daily journey. We help them commute smarter, safer, and more affordably.
Narrative

At the University of Minnesota Twin Cities, sustainability isn’t just a mission. It’s a movement, powered by the people who make our campus thrive.
Every commute is a choice, and every choice adds up. We know the realities: long drives, crowded roads, winter weather. But with robust transit options, campus biking infrastructure, and new benefits like the Universal and Employee Transit Passes, better alternatives are already here—and getting better.
Whether you’re a student trying to save money or a staff member looking to reduce stress, we’re making it easier to leave your car behind without giving up your time, safety, or comfort. Together, we can build a campus that moves smarter and leads bolder.
Value Proposition
The University of Minnesota offers an ecosystem of alternative transportation options: free campus buses, subsidized regional transit, and extensive bike infrastructure. These collectively provide a cheaper and healthier commute for community members. Unlike generic transit campaigns, this effort will address real barriers and provide localized solutions with a measurable impact. We are not forcing change; we are unlocking better choices.
- Practical: We think about real–life challenges and logistics.
- Empowering: We encourage autonomy by showing that better choices are within reach.
- Relatable: We share peer stories and user experiences, rather than relying on directives.
- Optimistic: We frame sustainable commuting as a win for everyone.
- Progressive: We are a leader in sustainable transportation.
- Tone: Friendly, clear, and confident without being overly preachy.
- Style: Conversational and concise. We balance emotion and evidence, leaving out the fluff.
- Language: Prioritize words like “easy,” “smart,” “real,” and “everyday” over industry jargon like “modality shift” or “infrastructural improvement.”
- Platform Adaptability: Adjusts slightly to accommodate different audiences. When speaking with students, we are visual and peer-driven. Faculty and staff will engage with our content via an information–forward and utility-based approach.
Tactics
Tactics
A short-form video campaign featuring real students, staff, and faculty sharing their personal experiences with biking, carpooling, or transit that focuses on convenience and cost savings. Sprinkle in emotional wins, such as “my commute helps my wellbeing.”
- Channels: TikTok, Instagram Reels, YouTube Shorts
- Target Audience: Speaks directly to Commuter Claire and Reliable Roger through peer voice and authenticity.
- Brand Representation: Humanizes the brand and normalizes non-SOV options as being aspirational and modern
Interactive tabling events held early in the semester featuring route planning help, ZAP sign–ups, transit pass help, and bike maintenance tips. Attendees get free University–branded bike lights, U Card holders, and reflective wrist/ankle bands.
- Channels: In–person tabling, posters
- Target Audience: Engages the persuadable middle found in survey results, especially those who mentioned not knowing about existing programs
- Brand Representation: Optimistic and practical. We position the University as a helpful partner in improving everyday life.
An interactive tool built into the PTS website, accessible via social media, enables users to input their commute distance and compare the costs and times of driving, biking, and transit, including the expenses of parking and transit passes.
- Channels: Email campaign, website, digital signage, posters
- Target Audience: Strongest fit for Reliable Roger, speaking to the logic–first decision makers
- Brand Representation: Smart and empowering, letting users make informed, independent choices
Tactics
A digital onboarding packet sent to new staff with personalized map links, how–to videos for bus and light rail, information on the Employee Transit Pass, and commuting tips.
- Channels: Automated emails, MyU Portal, LinkedIn
- Target Audience: Especially useful to make new hires less intimidated by transit
- Brand Representation: Clear, practical, and supportive by coming across as a trusted advisor versus a scolding authority
A time–limited campaign where commuters are encouraged to try public transit once a week and submit their experiences for a chance to win prizes like gift cards or commute accessories.
- Channels: Email, social media, digital signage, MyU, departmental newsletters
- Target Audience: A strong behavioral nudge for staff, especially if departments fall behind. Adding prizes adds gamification to build habits
- Brand Representation: Encouraging and motivational by reinforcing the idea that the University celebrates sustainability and convenience
Tactics
Targeted posters, digital ads, and social graphics that show the annual cost of SOV commuting versus transit or biking. Slogans could include “$1,200 on parking, or 120 burritos?” or “Lose the lot. Keep your paycheck.”
- Channels: Parking ramp signage, MyU, Instagram, and Facebook ads
- Target Audience: Commuter Claire and Reliable Roger, by referring to driving as an expensive habit versus a necessity
- Brand Representation: Clever and confident by being clear while emphasizing the benefits of change
Offer partial refunds or incentives to employees who voluntarily give up their SOV parking contracts and use an alternate for a semester. Track results and highlight stories in campus publications.
- Channels: MyU, Brief internal newsletter, LinkedIn
- Target Audience: Especially suited for staff who need a slight push and reassurance that transit is viable
- Brand Representation: Practical and empowering by showing the University “putting its money where its mouth is”
Theory
This campaign is grounded in three key communication and behavioral theories: the Uses and Gratifications Theory (Katz et al., 1973), the Nudge Theory (Thaler & Sunstein, 2008), and the Theory of Planned Behavior (Ajzen, 1985). These frameworks combine to inform both message design and channel strategy, ensuring tactics are visible and effective in changing behavior.
Implementation
The implementation of this strategic communication plan is designed to span the 2025–26 school year using a phased rollout of seven key tactics as described above. These tactics are aligned with the campaign’s behavior–change objective and prioritize peer–based storytelling, user–friendly resources, and gentle behavioral nudges. The implementation is designed to be primarily implemented by the existing PTS Communications Team, composed of a manager and two interns. View a GANTT chart of the proposed implementation below, followed by additional details.
Figure 1.7 (below) - Implementation Gantt chart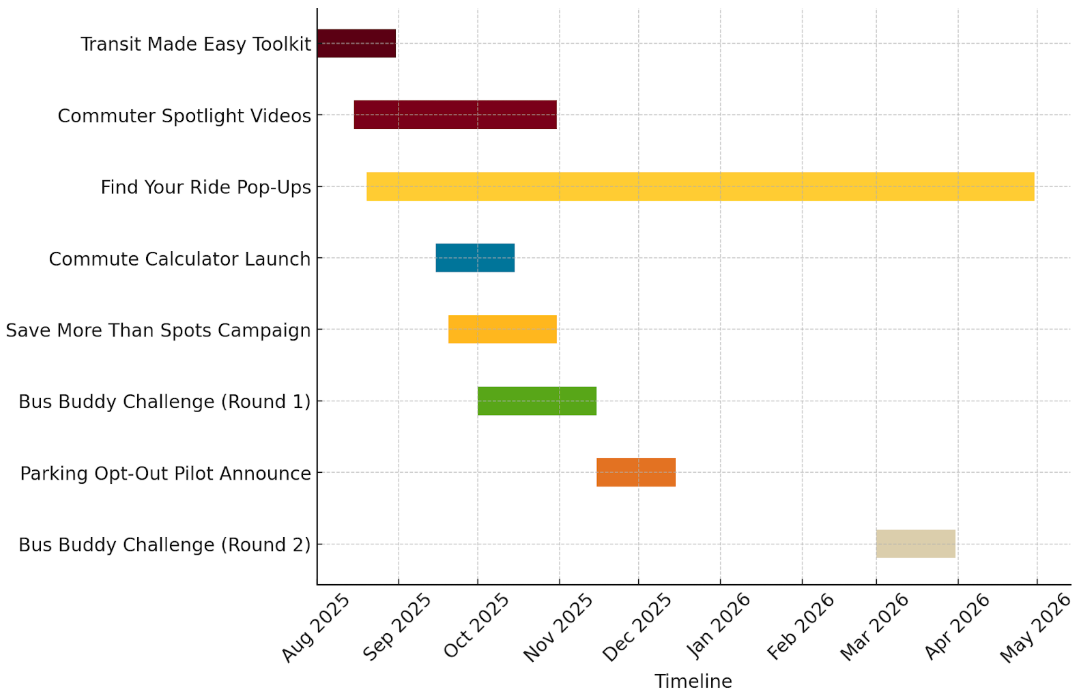
The campaign will kick off in August 2025 with the launch of the Transit Made Easy Toolkit – a digital onboarding resource distributed to new students and employers through automated emails. This will be followed by the debut of the Commuter Spotlight video series in mid-August, featuring short-form peer stories that will be posted weekly through October. Also beginning in August, the first round of Find Your Ride popup events will be held during Welcome Week and again during October and April, providing on–the–ground support, trip planning help, and giveaways.
In September 2025, the Commute Calculator will launch as a web-based tool, allowing users to input their commute details and compare the cost and time of various modes. This will be a high–impact but moderate–cost tactic, developed in collaboration with the PTS website contractor. At the same time, Save More Than Spots will launch a campaign across campus, utilizing posters, digital signage, and social media content to portray SOV commuting as expensive, rather than convenient. A second round of this campaign will carry through October, when many students are considering renewing parking contracts for spring.
The Bus Buddy Challenge will be staged in two waves. From October to November 2025 and March 2026, commuters will be invited to try public transit at least once a week and share their experiences on social media for a chance to win prizes. In November 2025, the Parking Opt–Out Incentive pilot will be announced, offering gift cards to employees who voluntarily give up their parking contract for the spring semester. This program will need to launch with limited enrollment to manage costs and gather impact data.
Most tactics can be executed with low investment. The estimated total cost of this campaign is $30,000, with the vast majority of funding tied to the development of a Commute Calculator and Parking Opt–Out Incentives. If the budget is constrained, the highest priority items are the calculator and video production.
Staffing needs can be met with current levels within Parking and Transportation Services and the Office of Sustainability. Collaboration with other University Services teams, namely IT and HR, will be key to conducting the campaign.
Finally, the phased implementation timeline aligns with key decision points in the academic calendar, meets people where they are at, and ensures that campaign visibility and engagement are sustained over time. Through these tools and coordinated timing, the University can take meaningful steps toward a more sustainable and less car–dependent campus culture.
Evaluation
To evaluate awareness, a follow–up survey will be conducted in May 2026 using key metrics from the campaign’s initial Spring 2025 survey as a benchmark. Specific questions will address respondents’ familiarity with programs like the Commute Calculator, Employee and Universal Transit Passes, and ZAP! Biking Rewards Program. Digital analytics (trackable Z-Links and QR codes, video views, and social engagement) will be tracked throughout the campaign to provide real–time insights. Analyzing the content of user–generated items during the Bus Buddy and Commuter Spotlight series will offer a more qualitative view into message resonance and social norm shifts.
To evaluate changes in behavior, the University’s biannual Transportation Mode Share Survey will be utilized to track shifts in modalities from SOVS to biking, transit, and carpooling. Supplementary data, such as Metro Transit ridership statistics tied to the transit pass programs, will offer more objective insights into the level of behavior change on campus.
To capture lessons for the future, each tactic will include built–in reflection checkpoints. For example, at the end of the Bus Buddy Challenge, participants will complete a brief feedback form about what motivated their participation and what would encourage them to keep using transit. The PTS team will regularly debrief after pop–up events to note which materials and incentives were most effective. These insights will be used to refine future iterations of the campaign and inform campus transportation programs more broadly.
References
View the PDF version for a list of all references.
Copyright © 2025 Nick Mabee. Cover Photo by Denys Nevozhai on Unsplash